Friday, September 13, 2013

Maize


RankAreaProduction (Int $1000)FlagProduction (MT)Flag
1United States of America26394688*313948610
2China, mainland9389697*192781000
3China8767674*192904232
4Brazil2753011*55660415
5India2643295*21760000
6Argentina2521698*23799830
7Indonesia1765008*17629033
8Ukraine1432302*22837900
9France1379151*15913300
10Nigeria891915*9180270
11South Africa846295*10360000
12Mexico774825*17635417
13Hungary751276*7992000
14Canada700023*10688700
15Ethiopia682230*4986125
16Romania674610*11717591
17United Republic of Tanzania504109*4340823
18Pakistan468486*4270900
19Kenya455747*3376862
20Malawi452717*3699147

agricultural trade


RankCommodityQuantity (tonnes)FlagValue (1000 $)FlagUnit value ($/tonne)
1Soybeans908139773514033251566
2Wheat1472059561511842642348
3Food Prep Nes13416474134989203033719
4Palm oil3658967254203427341149
5Maize1080671482363424895336
6Rubber Nat Dry7179256273376596264703
7Wine10004329203304135573303
8Coffee, green6445688342830355484391
9Bever. Dist.Alc4074220562794509196859
10Cake of Soybeans6359308442745804910432
11Meat-CattleBoneless(Beef&Veal)49318364526246728115322
12Cigarettes1003748135253815771225287
13Cheese of Whole Cow Milk47648534624670883135178
14Cotton lint78567602523177384142950
15Sugar Raw Centrifugal3383830362264989915669
16Pastry69580522822542345163240
17Chocolate Prsnes47175284822429658174755
18Chicken meat113914771721792056181913
19Pork52603974318300081193479
20Sugar Refined2192161181669463620762

Commodity agricultural production


RankCommodityProduction (Int $1000)FlagProduction (MT)Flag
1Rice, paddy186667648*722559584A
2Cow milk, whole, fresh183583111*614578723A
3Indigenous Cattle Meat170272001*63031582A
4Indigenous Pigmeat167007794*108641257A
5Indigenous Chicken Meat128199164*90001779A
6Wheat84281536*701395334A
7Soybeans65903601*262037569A
8Tomatoes58223483*159347031A
9Sugar cane56903836*1800377642A
10Maize55478433*885289935A
11Hen eggs, in shell53998997*65181280A
12Potatoes49681577*373158351A
13Vegetables fresh nes45936531*268833780A
14Grapes39494901*69093293A
15Buffalo milk, whole, fresh37673032*95811113A
16Cotton lint37363750*26143049A
17Apples31706244*75484671A
18Bananas29721954*107142187A
19Cassava24924197*256404044A
20Mangoes, mangosteens, guavas23338979*38953166A


Soybean oil


RankAreaProduction (Int $1000)FlagProduction (MT)Flag
1United States of America21816502*84191930
2Brazil20082317*74815447
3Argentina13121990*48878771
4India3172484*12214000
5Paraguay2173746*8309793
6China1721539*14485105
7China, mainland1721537*14485000
8Canada1026951*4246300
9Bolivia (Plurinational State of)477512*2299857
10Ukraine402618*2264400
11Uruguay401404*1541000
12Indonesia217470*843838
13Russian Federation215451*1756010
14South Africa186657*710000
15Nigeria135805*563810
16Italy132933*564638
17Serbia106793*440847
18Democratic People's Republic of Korea89419*350000*
19Viet Nam71950*266538
20Myanmar62185*236912


http://en.wikipedia.org/wiki/Soybean_oil  http://en.wikipedia.org/wiki/Soybean
http://faostat.fao.org/site/339/default.aspx


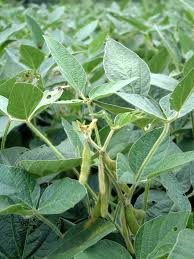
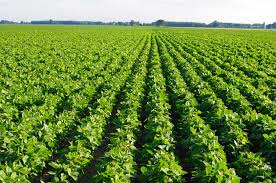
Soybeans are a globally important crop, providing oil and protein. In the United States, the bulk of the harvest is solvent-extracted with hexane, and the "toasted" defatted soymeal (50% protein) then makes possible the raising of farm animals (e.g. chicken, hog, turkey) on an industrial scale never before seen in human history. A very small proportion of the crop is consumed directly by humans.[citation needed] Soybean products do, however, appear in a large variety of processed foods.


Soybean futures are traded on the Chicago Board of Trade and have delivery dates in January (F), March (H), May (K), July (N), August (Q), September (U), November (X).
It is also traded on other commodity futures exchanges under different contract specifications:

Top Soybean Producers
in 2010
(million metric tons)
 United States90.6
 Brazil68.5
 Argentina52.6
 People's Republic of China15.0
 India9.8
 Paraguay7.4
 Canada4.3
 Uruguay1.8
 Ukraine1.68
 Bolivia1.63
World Total


File:2005soyabean.PNG
Google